
📊 Full opportunity report: AI In Warfare: Visualizing The Battle In Real-Time on ThorstenMeyerAI.com — validation score, market gap, and execution plan.
TL;DR
An innovative browser-based AI project visualizes live Bitcoin trades as a battlefield, depicting market activity through cinematic graphics. It connects to public exchange streams and offers an immersive, real-time experience without backend infrastructure.
An AI-driven visualization project has transformed live Bitcoin trading data into a cinematic battlefield, providing viewers with a real-time, immersive depiction of market activity. The tool, accessible via a web browser, connects directly to public exchange streams and visualizes the tug-of-war between buyers and sellers as a visceral war scene. This development showcases how advanced web technologies can be harnessed for creative data representation, offering a new perspective on cryptocurrency markets.
The project, hosted at war.isbitcoindead.com, uses browser-native technologies such as Canvas 2D graphics, WebAudio synthesis, and WebSocket streams to generate a live visualization of Bitcoin trades. It connects primarily to Binance’s public trade stream, with a fallback to Coinbase, ensuring continuous data flow. Every trade is represented as a combatant—buy orders from the ‘Cobalt Host’ push the front line from the left, while sell orders from the ‘Ember Legion’ counter from the right. Large liquidations are visualized as airstrikes, adding to the war-like aesthetic.
The system features an automatic camera that shifts perspectives, a live DEFCON meter indicating market volatility, and a scrolling log narrating ongoing conflicts. A synthetic soundtrack, generated within the browser, heightens the immersive experience. The visualization is purely artistic and does not provide trading signals or financial advice, emphasizing its role as a creative data art piece rather than a trading tool.
Implications of Visualizing Market Data as Warfare
This project demonstrates the potential of web-based technologies to create immersive, artistic representations of complex financial data, making market activity accessible to a broader audience. It also highlights the increasing intersection of art, technology, and finance, raising questions about how data visualization can influence perceptions of market chaos and volatility. While purely visual and non-advisory, such tools could shape public understanding of trading dynamics and market sentiment.
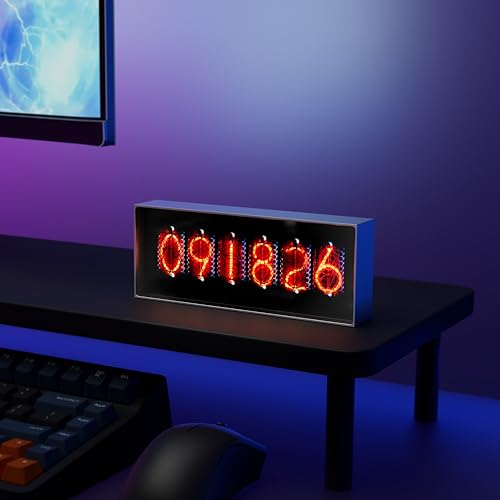
Electronic Display for Real-Time Cryptocurrency/Bitcoin/Stock Market Data, Time, Weather & Temperature, 164*28*65mm, Supports Image Upload and 30s Video Playback, App-Controlled, 960*360 Resolution
- Real-Time Data Display: Cryptocurrency, stock, time, weather updates
- Custom Media Uploads: Upload images and 30s videos
- App-Controlled Management: Control content and display modes
As an affiliate, we earn on qualifying purchases.
As an affiliate, we earn on qualifying purchases.
Evolution of Data Visualization in Cryptocurrency Markets
Recent years have seen a surge in creative approaches to visualizing cryptocurrency data, from simple graphs to complex simulations. This project builds on that trend by offering a real-time, cinematic experience that transforms raw trade data into a visceral battlefield. It reflects broader advances in browser technology and web graphics, enabling highly interactive and visually rich applications without heavy backend infrastructure. The project’s launch aligns with growing interest in artistic data representations as a way to engage audiences and foster understanding of market volatility.
“This visualization offers a new way to experience market activity—like watching a live war zone unfold, driven entirely by real trades.”
— an anonymous researcher
Electronic Display for Real-Time Cryptocurrency/Bitcoin/Stock Market Data, Time, Weather & Temperature, 164*28*65mm, Supports Image Upload and 30s Video Playback, App-Controlled, 960*360 Resolution
- Real-Time Data Display: Cryptocurrency, stock, time, weather updates
- Custom Media Uploads: Upload images and 30s videos
- App-Controlled Management: Control content and display modes
As an affiliate, we earn on qualifying purchases.
As an affiliate, we earn on qualifying purchases.
Limitations and Unanswered Questions About the Visualization
It is not yet clear how accurately the visualization reflects actual market sentiment or whether it influences public perception of volatility. The project is purely artistic and does not provide trading signals or predictive insights. Additionally, the long-term impact of such visualizations on market behavior or investor psychology remains unknown. Technical limitations, such as the reliance on public streams and browser performance, could also affect its fidelity and accessibility.
web-based market data visualization tool
As an affiliate, we earn on qualifying purchases.
As an affiliate, we earn on qualifying purchases.
Future Developments and Potential Expansions of the Project
Developers may enhance the visualization with more detailed analytics or interactive features, potentially integrating additional data sources or expanding to other cryptocurrencies. There could also be efforts to study how viewers interpret the war-like imagery and whether it affects their understanding of market volatility. As web technology advances, more sophisticated and immersive visualizations could emerge, further blending art and finance in real-time data displays.
interactive crypto trading monitor
As an affiliate, we earn on qualifying purchases.
As an affiliate, we earn on qualifying purchases.
Key Questions
Is this visualization meant for trading or investment decisions?
No. The project is purely artistic and does not provide trading signals or financial advice. It visualizes market data for creative and educational purposes only.
How does the visualization work technically?
It uses browser-native technologies such as Canvas 2D graphics, WebAudio, and WebSocket streams to render real-time trade data as a cinematic battlefield, all running client-side without backend servers.
Can I customize or interact with the visualization?
Currently, the visualization is designed as a passive, real-time display. Future versions may include interactive features, but the current setup is primarily for viewing and experiential immersion.
Does this project have any impact on actual market behavior?
There is no evidence to suggest it influences market activity. It remains a visualization tool intended for artistic expression and data presentation.
Is this available for free?
Yes, the visualization is accessible for free to anyone with a modern web browser.
Source: ThorstenMeyerAI.com