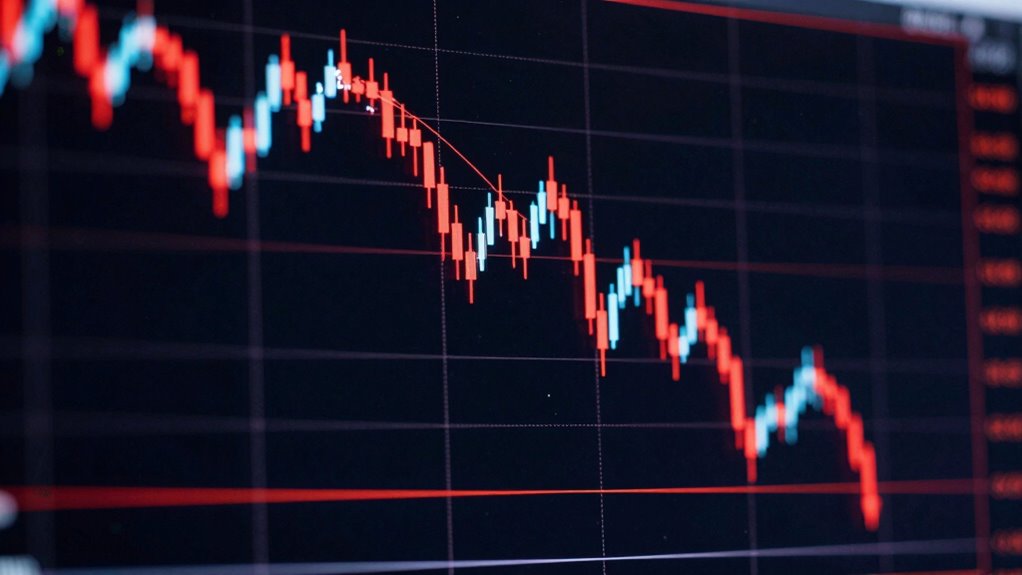
A bear flag on a crypto chart suggests a potential continuation of a downtrend after a brief consolidation. You’ll notice it forms after a sharp decline, with prices moving sideways or slightly upward in a small channel, indicating sellers are still in control. When the price breaks below the flag’s support level, it usually signals further declines. Paying attention to volume and confirmation tools can help you navigate these signals more confidently—if you’re curious, there’s more to uncover.
Key Takeaways
- A bear flag indicates a potential continuation of a downtrend after a sharp decline.
- It forms during consolidation in a small, slightly upward or sideways channel following a flagpole.
- The pattern reflects market psychology where sellers dominate despite brief buying interest.
- A break below the flag’s support signals further price decline and possible short-selling opportunities.
- Increased volume during breakout confirms strong seller momentum and enhances prediction reliability.

Ever wondered what a bear flag indicates on a crypto chart? It’s an important pattern that traders pay close attention to because it signals a potential continuation of a downtrend. When you spot a bear flag, it suggests that sellers are in control, and the price may soon break lower, continuing the decline. Recognizing this pattern can be a game-changer in your trading strategies, helping you to make timely decisions to maximize profits or minimize losses.
A bear flag signals a potential continuation of a downtrend, indicating sellers are in control and prices may break lower.
The bear flag forms after a sharp decline in price, which acts as the flagpole. Following this steep drop, the price consolidates in a small, parallel channel that slopes slightly upward or moves sideways. This consolidation is essential because it reflects market psychology—buyers temporarily pushing back against the selling pressure, creating a brief pause. However, the dominant market sentiment remains bearish, and traders who understand this pattern use the flag as a confirmation to prepare for a further decline once the price breaks below the flag’s lower boundary. Recognizing the chart pattern can help traders anticipate the next move more accurately.
Market psychology plays a significant role here. The pattern shows that, despite some short-term buying interest, the overall sentiment favors bears. Traders often interpret the flag as a “pause” before the next wave down, which aligns with the idea that the market is still in a downtrend. When you see the price breaking below the flag’s support level, it’s a strong signal to think about short-selling or closing long positions. The volume often increases during the breakout, reinforcing the idea that sellers are taking control once again. Additionally, understanding the importance of contrast ratio can help traders evaluate the visual quality of chart patterns and indicators used for confirmation. Recognizing market psychology is crucial for understanding the significance of chart patterns. A comprehensive understanding of technical analysis can further improve the accuracy of predictions based on this pattern. Moreover, observing volume confirmation can help traders filter out false signals and act with greater confidence.
Incorporating this pattern into your trading strategies requires discipline and an understanding of the broader market context. Don’t rely solely on the pattern; always confirm the breakout with volume and other technical indicators. Remember, false breakouts can happen, so it’s wise to wait for a clear move below the flag before acting. By understanding both the technical structure and the underlying market psychology, you can develop more effective strategies to navigate crypto trends. Recognizing the bear flag pattern allows you to anticipate potential declines and position yourself accordingly, giving you an edge in a highly volatile market.

Trading: Technical Analysis Masterclass: Master the financial markets
Language: english
As an affiliate, we earn on qualifying purchases.
As an affiliate, we earn on qualifying purchases.
Frequently Asked Questions
How Reliable Is the Bear Flag Pattern for Predicting Price Drops?
The bear flag pattern can be a reliable indicator for predicting price drops, especially when market psychology signals bearish sentiment. You should watch for decreasing trading volume during the flag formation, confirming the pattern’s validity. When volume picks up on the breakout, it suggests strong selling pressure. However, no pattern guarantees accuracy, so always combine it with other indicators and analysis to make well-informed trading decisions.
Can a Bear Flag Appear on All Types of Cryptocurrencies?
Yes, a bear flag can appear on all types of cryptocurrencies. Market psychology and trading psychology drive these patterns, reflecting widespread trader sentiment during downtrends. When traders expect prices to fall, they create the conditions for bear flags across different crypto assets. Recognizing this pattern helps you understand the collective mindset, making it easier to anticipate potential price drops regardless of the specific cryptocurrency you’re analyzing.
What Are Common Mistakes When Identifying a Bear Flag?
Ever wonder if you’re misreading a market pattern? Common mistakes when identifying a bear flag include confusing it with a consolidation or correction phase, ignoring volume signals, and rushing to conclusions without confirming a breakout. Market psychology plays a big role here, as false flags can deceive traders. To avoid errors, carefully analyze chart patterns, wait for confirmation, and consider volume trends before acting on a bear flag.
How Does Volume Change Typically Occur During a Bear Flag Formation?
During a bear flag formation, volume analysis shows a decline in volume as the price consolidates within the flag, indicating reduced buying interest. When the breakout occurs, you’ll notice a surge in volume, confirming the trend reversal. This increase in volume is essential for trend confirmation, as it signals strong seller momentum and validates the bearish move. Always watch volume patterns closely to improve your chances of accurately identifying the breakout.
Are There Any Indicators to Confirm a Bear Flag Breakout?
Like a detective uncovering clues, you can confirm a bear flag breakout with indicators such as volume spikes and moving average crossovers. Market psychology often signals panic selling, aligning with increased volume. Trading psychology plays a role, as traders become more confident in a downtrend when these signals appear. Combining these indicators helps you verify breakouts, reducing false signals and enhancing your confidence in executing timely trades.

12Pcs Trading Chart Pattern Posters Candlestick Pattern Poster Bulletin Board Crypto and Stock Market Trading Poster Office Decorations for Trader Investor Supplies Wall Door Decor 11 x 15.7 Inches
Package includes: This set includes 12 trading chart pattern posters and 100 adhesive dots, providing you with all…
As an affiliate, we earn on qualifying purchases.
As an affiliate, we earn on qualifying purchases.
Conclusion
In summary, spotting a bear flag signals a potential plunge, so stay sharp and scrutinize the subtle signs. Recognize the rally’s reversal and prepare for a possible pullback, practicing patience and prudence. By understanding the pattern’s purpose and predicting the price’s direction, you can better brace for the bearish break. Remember, being vigilant and vigilant helps you avoid the pitfalls and capitalize on the crypto chart’s clues. Stay savvy, stay strategic!

Volume Trading Indicators & Oscillators: Volume-Weighted Average Price (VWAP), Chaikin Money Flow, Chaikin Oscillator, Twiggs Money Flow, A/D Line (Volume Analysis & Strategies)
As an affiliate, we earn on qualifying purchases.
As an affiliate, we earn on qualifying purchases.

The New Sell and Sell Short: How To Take Profits, Cut Losses, and Benefit From Price Declines (Wiley Trading)
As an affiliate, we earn on qualifying purchases.
As an affiliate, we earn on qualifying purchases.