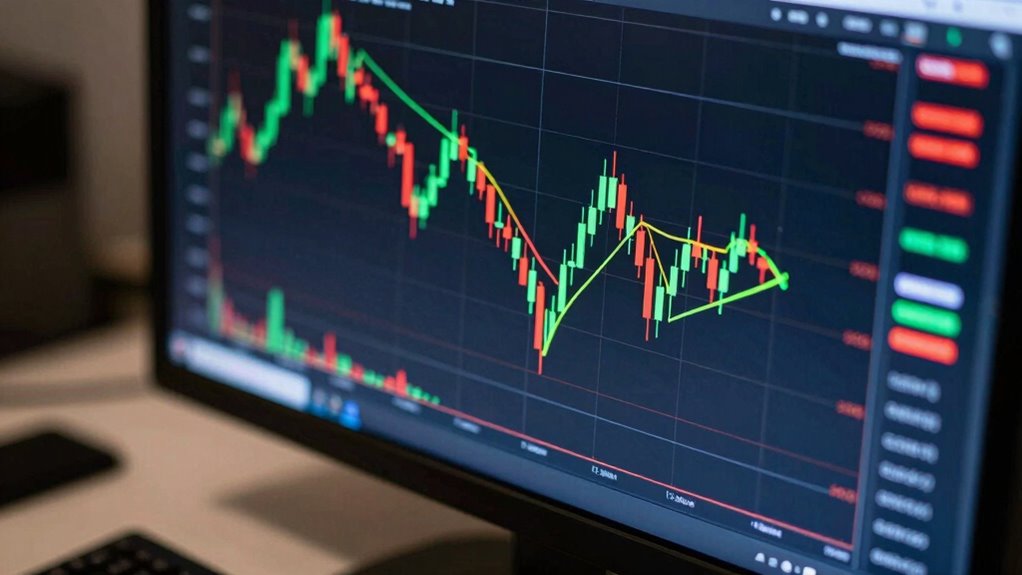

To understand divergence on a crypto chart, look for differences between the price and technical indicators like RSI or MACD. When the price makes new highs or lows, but the indicator doesn’t confirm it, that’s a sign of divergence, which can warn of a potential trend reversal or slowdown. Recognizing these signals involves analyzing how momentum shifts while price actions stay the same or weaken. Keep exploring further to learn how to spot and confirm these important clues confidently.

Get hardware and tech essentials delivered free with Prime
- Fast, free delivery on millions of items
- Prime Video, Amazon Music and more included
- Member-only deals all year
Key Takeaways
- Identify price highs/lows that do not match corresponding indicator peaks/troughs.
- Use indicators like RSI, MACD, or Stochastic to detect divergence signals.
- Recognize bearish divergence when price makes new highs but indicators fail; bullish when lows diverge.
- Confirm divergence with additional technical analysis tools and overall market context.
- Remember divergence indicates potential trend weakening but does not guarantee reversals.
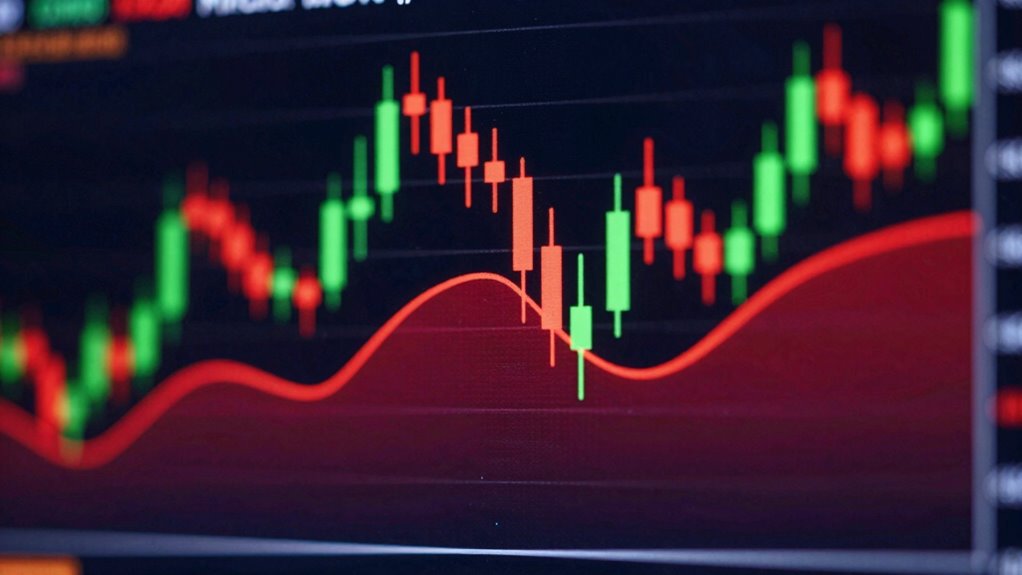
Divergence is a powerful tool for traders to spot potential trend reversals on crypto charts, but understanding it can seem tricky at first. It requires you to pay close attention to how price movements relate to technical indicators, which act as visual cues for market momentum. Recognizing divergence involves more than just spotting differences; it’s about understanding the underlying trading psychology that influences market behavior. When you see divergence, it often signals that the current trend may be weakening, giving you a chance to prepare for an upcoming reversal or consolidation.
Technical indicators like RSI (Relative Strength Index), MACD (Moving Average Convergence Divergence), or stochastic oscillators are commonly used to identify divergence. For example, if the price makes a new high but your RSI fails to reach a new high, that’s a classic sign of bearish divergence. Conversely, if the price hits a new low but the RSI stays above its previous low, that indicates bullish divergence. These signals don’t guarantee a reversal but highlight a potential shift in momentum, prompting you to analyze further before making decisions. It’s essential to combine divergence signals with other technical indicators and chart patterns to increase their reliability.
Understanding divergence also involves managing your trading psychology effectively. When you spot divergence, it can evoke a mix of excitement and doubt. Confidence in your analysis grows when you see multiple indicators confirming the same signal, but overconfidence can lead to impulsive trades. Staying disciplined and not rushing into trades based solely on divergence alerts is key. Remember, divergence is a warning sign, not a certainty. It’s about reading the market’s subtle cues and respecting the uncertainty that comes with trading cryptocurrencies. Recognizing market sentiment can help you interpret divergence more accurately and avoid false signals.
Practicing patience and maintaining a clear mindset helps you interpret divergence more accurately. As you gain experience, you’ll start to see how divergence fits into the bigger picture—supporting your overall trading plan, rather than dictating every decision. Technical indicators are tools that help you decode market sentiment, but your trading psychology ultimately influences how well you interpret those signals. It’s also important to understand the market context, which can help you distinguish between false signals and genuine opportunities. Developing a trading discipline is crucial for managing these signals effectively. A deeper understanding of technical analysis can further enhance your ability to interpret divergence and other market signals. Always keep a level head, and use divergence as part of a comprehensive approach that includes proper risk management and a solid understanding of market context. When you master these aspects, divergence becomes a valuable part of your trading toolkit, helping you better anticipate trend changes in the volatile world of crypto.
RSI divergence indicator for crypto trading
As an affiliate, we earn on qualifying purchases.
As an affiliate, we earn on qualifying purchases.
Frequently Asked Questions
What Are the Different Types of Divergence in Crypto Charts?
You’ll find three main types of divergence in crypto charts: regular, hidden, and exaggerated. Regular divergence signals potential trend reversals, often confirmed by price patterns and trend confirmation signals. Hidden divergence suggests trend continuation, while exaggerated divergence indicates overextended price moves. Recognizing these types helps you spot potential buy or sell signals, improving your trading strategy by understanding when the trend might change or continue based on divergence cues.
How Reliable Is Divergence as a Trading Signal?
Divergence can be a helpful trading signal, but its reliability varies with market psychology. When divergence occurs, it indicates a potential shift in momentum, making it a useful indicator. However, it shouldn’t be used alone; always consider other technical signals for confirmation. While divergence provides insights, its indicator reliability depends on market conditions, so you should combine it with volume analysis and broader trend context for better accuracy.
Can Divergence Predict the Exact Price Reversal Point?
Imagine you’re steering a ship, and divergence is like a lighthouse warning of a storm ahead. It can’t predict the exact price reversal point, but it signals a potential shift in trend. Market psychology and trading psychology play critical roles here; divergence indicates underlying momentum changes. You should view it as a helpful clue rather than a precise arrow, guiding your judgment rather than dictating exact entry or exit points.
How Do Volume Indicators Relate to Divergence Signals?
Volume indicators provide vital volume confirmation when analyzing divergence signals. If you see a divergence on price or indicator lines, compare it with volume to strengthen your analysis. Increasing volume alongside divergence suggests strong conviction, confirming potential reversals. Conversely, low volume may weaken the signal. Use volume confirmation as an integral part of your indicator comparison process to improve the accuracy of your divergence-based trading decisions.
Is Divergence More Effective on Certain Cryptocurrencies?
Ever wondered if divergence works better on certain cryptocurrencies? It really depends on market sentiment and regulatory impact. Some coins with high volatility or clear trends show divergence signals more effectively, helping you spot potential reversals. Less regulated or more stable cryptocurrencies might not display as strong signals. Pay attention to how news and regulations influence your chosen crypto, making divergence a more reliable tool in those contexts.
As an affiliate, we earn on qualifying purchases.
Conclusion
Understanding divergence is like catching a whisper before it turns into a shout—you get to spot hidden signals early. When you recognize these signs on your crypto charts, you gain an edge, like having a map in unfamiliar territory. Keep practicing, stay alert, and you’ll start noticing these subtle clues more often. Remember, divergence isn’t just a fancy term; it’s your tool to make smarter moves in the unpredictable world of crypto trading.
cryptocurrency technical analysis chart patterns
As an affiliate, we earn on qualifying purchases.
As an affiliate, we earn on qualifying purchases.
stochastic oscillator for crypto trading
As an affiliate, we earn on qualifying purchases.
As an affiliate, we earn on qualifying purchases.
Columbus Day / Indigenous Peoples' Day Picks
long weekend sales
As an affiliate, we earn on qualifying purchases.