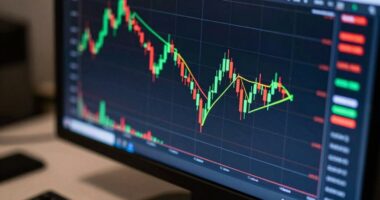

A bull flag on a crypto chart signals a potential continuation of the current uptrend, showing a brief pause during strong buying activity. You’ll see a sharp price rise followed by a sideways or slightly downward consolidation, which reflects trader indecision and profit-taking. When the price breaks above the flag’s resistance with increased volume, it suggests renewed buying momentum. Understanding these patterns can help you spot opportunities; exploring further reveals even more insights into this powerful indicator.
Key Takeaways
- A bull flag indicates potential continuation of an uptrend after a brief consolidation period.
- It forms after a sharp upward move, known as the “flagpole,” signaling strong prior buying activity.
- Breakouts above the flag’s resistance with increased volume suggest a likely surge in price.
- The pattern reflects trader indecision during profit-taking, but underlying strength remains intact.
- Confirming a breakout and managing risk with stop-loss orders are essential for profitable trading.

Have you ever wondered what a bull flag indicates on a crypto chart? It’s a pattern traders watch closely because it often signals a potential continuation of an uptrend. When you see a bullish flag forming, you’re observing a pause amidst strong buying activity, which suggests that the market psychology remains optimistic. Traders interpret this pattern as a sign that the previous upward momentum is likely to resume after a brief consolidation. Recognizing a bull flag can give you an edge in implementing breakout strategies, allowing you to act swiftly when the price breaks above the flag’s upper boundary.
The pattern itself appears as a small rectangular consolidation that slopes slightly downward or moves sideways, following a sharp upward move called the “flagpole.” This consolidation reflects a moment of indecision among traders, where profit-taking or short-term hesitation occurs, but the overall market sentiment stays bullish. During this phase, the supply and demand balance shifts, but the underlying strength remains intact. When the breakout happens—meaning the price moves convincingly above the upper trendline—you can expect a surge in buying pressure, often leading to a significant price rise. This is why understanding the market psychology behind the pattern is crucial; it indicates that buyers are gaining control again, and the previous rally is likely to continue. Additionally, recognizing the market psychology during these formations helps traders anticipate future movements more accurately.
In terms of breakout strategies, the key is to wait for confirmation. You don’t want to jump in too early, risking false signals. Instead, look for a decisive close above the upper trendline of the flag with increased volume. Volume confirms the strength of the breakout—higher volume suggests more traders are stepping in, reinforcing the likelihood of a sustained move upward. Once the breakout occurs, many traders set entry points just above the flag’s resistance line, with stop-loss orders placed below the flag’s low to manage risk. This approach aligns with the market psychology that favors momentum and helps you capitalize on the continuation of the uptrend. Being aware of technical analysis principles can further refine your entry and exit points, increasing your chances of success.
Understanding what a bull flag means on a crypto chart isn’t just about identifying the pattern; it’s about grasping the collective mindset of traders during these formations. When you recognize the signs—consolidation after a sharp rise, increased volume on breakout—you’re equipped to execute breakout strategies confidently. In the fast-moving crypto market, acting on these patterns quickly can make all the difference between catching a profitable move and missing out. So, paying close attention to the market psychology embedded in the pattern can help you stay ahead and make more informed trading decisions.
STOCK TRADING STRATEGIES: A Comprehensive Guide to Profitable Investing & Winning Strategies for Consistent Stock Market Profits (Technical Analysis in Trading)
As an affiliate, we earn on qualifying purchases.
As an affiliate, we earn on qualifying purchases.
Frequently Asked Questions
How Reliable Are Bull Flags as Trading Signals?
Bull flags can be fairly reliable trading signals if you understand market psychology and pattern variations. They reflect a temporary pause in an uptrend as traders consolidate before pushing higher. However, you should use them alongside other indicators to confirm signals, as false breakouts happen. By analyzing volume and pattern nuances, you increase your chances of accurately interpreting bull flags and making informed trading decisions.
What Are Common Mistakes When Trading Bull Flags?
When trading bull flags, you often make mistakes like ignoring volume confirmation or rushing the breakout timing. You might enter too early before the breakout is confirmed by increased volume, risking false signals. Alternatively, waiting too long can cause missed opportunities. To avoid these errors, guarantee volume confirms the move and wait for the right breakout timing. Stay disciplined, and don’t jump in prematurely or delay your entry unnecessarily.
How Can I Identify a False Bull Flag Pattern?
You can identify a false bull flag by watching for inconsistent volume confirmation—if volume doesn’t pick up during the breakout, it might be false. Also, pay attention to breakout timing; if the price moves prematurely or stalls after a brief surge, it could be a trap. Always wait for strong volume confirmation and proper breakout timing to validate the pattern and avoid false signals.
What Timeframes Are Best for Spotting Bull Flags?
When it comes to spotting bull flags, don’t put all your eggs in one basket—use multiple timeframes for better accuracy. Daily and 4-hour charts are ideal, as they help you see clear volume confirmation and breakout timing. Shorter timeframes can be noisy, but longer ones give you a better picture of the trend. Keep an eye on these, and you’ll catch the pattern before it’s too late.
Do Bull Flags Work Better in Certain Cryptocurrencies?
Bull flags tend to work better in cryptocurrencies with strong market sentiment and high trading volume. When the market feels optimistic, these patterns are more reliable because traders actively buy and sell, confirming the breakout. Lower volume or uncertain sentiment can weaken the pattern’s effectiveness. You should watch for cryptocurrencies with steady volume increases and positive sentiment, as these signals help validate the bullish continuation indicated by a bull flag.

Crypto Trading Mat for Desk – Crypto Mouse Pad with Candlestick Chart Patterns – Excel & Word Shortcuts – Anti-Slip Durable & Smooth Surface – Gifts for Crypto Lovers and Traders
- Complete Crypto Trading Guide: Includes candlestick patterns and chart formations
- Productivity Shortcuts: 55 Excel and 52 Word shortcuts included
- Blockchain Education: Explains cryptocurrency technology and fundamentals
As an affiliate, we earn on qualifying purchases.
As an affiliate, we earn on qualifying purchases.
Conclusion
So, when you spot a bull flag on a crypto chart, you’re witnessing a potential rocket-launch moment for prices. It’s like catching lightning in a bottle—signaling that a strong upward move could be just around the corner. Keep your eyes peeled and your strategy sharp, because missing this signal could mean missing out on a life-changing gain. Stay vigilant, and remember: in the wild world of crypto, opportunities like this come once in a blue moon.

How to Day Trade for a Living: A Beginner’s Guide to Trading Tools and Tactics, Money Management, Discipline and Trading Psychology (Stock Market Trading and Investing)
- Work Anywhere: Trade from anywhere in the world
- Flexible Schedule: Decide your own working hours
- Self-Directed: Answer only to yourself
As an affiliate, we earn on qualifying purchases.
As an affiliate, we earn on qualifying purchases.

How to Create and Use Effective Stop Loss and Take Profit Orders: Master the Psychology, Math, and Strategy Behind Every Exit — Build Discipline and Profitability in Crypto Trading
As an affiliate, we earn on qualifying purchases.
As an affiliate, we earn on qualifying purchases.