
To interpret the MACD in crypto, look for when the MACD line crosses the signal line; a cross above suggests a potential buy, while below indicates a sell. Watch for divergence patterns—higher highs in price with lower highs in MACD hint at a possible reversal, and vice versa. Also, observe the gap between the lines for momentum strength. If you keep exploring, you’ll discover how these signals work together for better trading decisions.
Key Takeaways
- Identify bullish and bearish crossovers between the MACD line and signal line for potential buy or sell signals.
- Look for divergence patterns where price and MACD move opposite to forecast trend reversals.
- Observe the distance between MACD and the signal line to gauge the strength of current momentum.
- Use MACD in conjunction with support/resistance levels to confirm trend changes.
- Be cautious of false signals in volatile or sideways markets; combine MACD with other indicators.
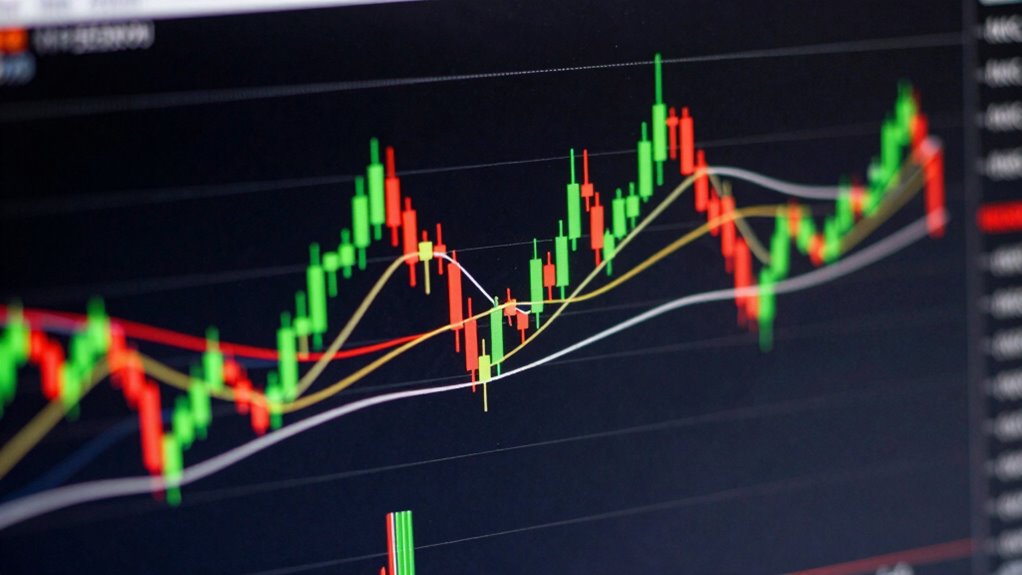
If you’re looking to improve your crypto trading strategy, understanding how to read the MACD indicator is vital. The Moving Average Convergence Divergence (MACD) is a powerful tool that helps you identify momentum shifts and potential trend reversals. One of its key features is the ability to spot divergence patterns, which can signal that a trend is weakening or about to change direction. Divergence occurs when the price of a crypto asset moves in one direction while the MACD indicator moves in the opposite. For example, if the price hits higher highs but the MACD forms lower highs, it suggests bearish divergence, hinting at a potential reversal downward. Conversely, if the price makes lower lows but the MACD forms higher lows, bullish divergence might be forming, indicating a possible upward move. Recognizing these patterns requires careful observation, as they often precede significant price actions. Additionally, understanding the MACD’s components helps traders interpret signals more accurately. Signal line analysis is another vital aspect of reading the MACD. The MACD consists of two lines: the MACD line itself and the signal line, which is typically a 9-period exponential moving average (EMA) of the MACD line. When the MACD crosses above the signal line, it generates a bullish signal, suggesting it might be time to buy or enter an upward trade. Conversely, when the MACD crosses below the signal line, it indicates a bearish signal, hinting that you should consider selling or preparing for a downward move. These crossovers are often most reliable when they occur near key support or resistance levels or after a divergence pattern has been identified. Recognizing the importance of trend strength can also help you gauge whether a signal is likely to lead to a sustained move or a short-term correction. It is also beneficial to understand the market conditions, as they can significantly influence the reliability of MACD signals, especially in volatile or sideways markets. It’s also helpful to consider the impact of market conditions on the effectiveness of MACD signals, as different environments can influence its reliability. Moreover, staying informed about market volatility can help you avoid false signals and enhance your trading accuracy. It’s important to note that the MACD isn’t foolproof. Sometimes, the indicator may give false signals, especially in choppy or sideways markets. That’s why combining divergence pattern recognition with signal line analysis enhances your trading accuracy. When you see a divergence pattern aligning with a MACD crossover, it strengthens the case for a trend reversal. Additionally, observing the distance between the MACD line and the signal line can give you insights into the strength of the current momentum; wider gaps suggest stronger momentum, while narrowing gaps indicate weakening trends.

MACD for Beginners: Understanding the Most Popular Momentum Indicator in Trading (The Technical Indicator Series)
As an affiliate, we earn on qualifying purchases.
As an affiliate, we earn on qualifying purchases.
Frequently Asked Questions
Can MACD Signals Be Used Alone for Trading Decisions?
You shouldn’t rely solely on MACD signals for trading decisions. While the MACD helps identify trend confirmation and divergence signals, combining it with other indicators reduces false signals and improves accuracy. Use MACD alongside price action, volume, or support and resistance levels to get a clearer market picture. This integrated approach boosts confidence in your trades, helping you avoid mistakes caused by relying on a single indicator.
How Does MACD Perform in Highly Volatile Crypto Markets?
In volatile crypto markets, the MACD acts like a weather vane, flickering wildly with market momentum shifts. It’s useful for trend confirmation, but beware—sharp price swings can cause false signals, making it less reliable for precise timing. You need to combine MACD insights with other tools to navigate the storm. Stay alert, interpret carefully, and don’t rely solely on MACD in choppy waters.
What Are Common Pitfalls When Interpreting MACD in Crypto?
You should watch out for false signals when interpreting the MACD in crypto, especially during volatile markets. A common pitfall is mistaking MACD divergence for a trend reversal, which can lead to poor trading decisions. Always confirm signals with other indicators, as divergence might not always signal a genuine change. Relying solely on MACD without context increases the risk of acting on false signals.
How Do Different Time Frames Affect MACD Analysis?
Different time frames profoundly impact MACD analysis through time frame dynamics, affecting your perception of trend strength and momentum. Shorter periods offer quicker signals but can produce more false positives, while longer frames provide more reliable trends. Always seek signal confirmation across multiple time frames to avoid misinterpretation. Combining insights from various periods helps you make more accurate trading decisions, reducing the risk of acting on false signals.
Is MACD More Effective Than Other Technical Indicators in Crypto?
Yes, the MACD can be more effective than other technical indicators in crypto because it clearly shows market momentum and helps confirm trends. You can rely on MACD to identify potential buy or sell signals by watching for crossovers and divergence. While no single indicator is perfect, combining MACD with others improves your accuracy in trend confirmation, giving you a better edge in volatile crypto markets.

Mastering MACD: Unlocking Powerful Trading Signals for Stocks, Forex, Futures & Crypto (Technical Analysis Mastery)
As an affiliate, we earn on qualifying purchases.
As an affiliate, we earn on qualifying purchases.
Conclusion
By mastering the MACD indicator, you gain a powerful tool to spot trend reversals and momentum shifts in crypto markets. Remember, studies show traders who effectively use technical indicators like MACD increase their success rate by over 30%. So, stay patient, practice interpreting signals, and trust your analysis. With consistent effort, you’ll become more confident in making timely, informed trading decisions—turning insights into profitable actions in your crypto journey.
MACD for Beginners: Understanding the Most Popular Momentum Indicator in Trading (The Technical Indicator Series)
As an affiliate, we earn on qualifying purchases.
As an affiliate, we earn on qualifying purchases.

Chart Logic – Technical Analysis Handbook (Color Edition): The Comprehensive Guide to Trading Cryptocurrencies and Tools to Outperform Your Basic Buy and Hold Investor
As an affiliate, we earn on qualifying purchases.
As an affiliate, we earn on qualifying purchases.