To use dominance charts for understanding market rotation, focus on tracking shifts in sector strength in real time. Look for sudden spikes or declines in dominance, especially when backed by volume increases, to identify strong moves or potential reversals. Comparing sectors helps you spot leading or lagging areas and spot early signs of rotation. Recognizing these patterns can improve your timing and decision-making, and if you keep exploring, you’ll uncover more ways to interpret these signals effectively.
Key Takeaways
- Monitor shifts in sector dominance to identify emerging leaders and laggards during market rotation.
- Analyze volume alongside dominance changes to confirm the strength of sector moves.
- Compare sector dominance levels to spot relative strength and potential rotation opportunities.
- Observe sudden spikes or declines in dominance and volume for early signals of trend reversals.
- Use dominance patterns over time to recognize phases of rotation and anticipate market shifts.
Understanding market rotation is essential for making informed investment decisions, and dominance charts offer a powerful tool to visualize these shifts. These charts help you see which sectors are gaining or losing strength in real time, providing clarity amidst market fluctuations. One of the key ways to interpret dominance charts is through volume analysis. By examining trading volume alongside sector performance, you can determine the conviction behind a move. For instance, a sector showing increasing dominance on a volume surge signals strong investor interest, suggesting the trend may continue. Conversely, a rise in dominance on low volume might indicate a false start or a temporary shift that could reverse.
Using sector comparison within dominance charts allows you to gauge relative strength across different parts of the market. Instead of looking at sectors in isolation, you compare their dominance levels to see which are leading or lagging. When a sector’s dominance rises sharply compared to others, it indicates that investors are favoring that area, possibly due to favorable economic data, earnings reports, or macro trends. Recognizing these shifts early can help you reallocate your portfolio or tighten your stops to capitalize on emerging trends or avoid declining sectors.
Comparing sector dominance reveals relative strength, helping you identify leading areas and potential rotation opportunities.
To effectively use dominance charts, you should track how dominance levels change over time, paying attention to patterns and divergences. For example, if a sector’s dominance increases steadily but volume analysis shows waning trading activity, it could signal a weakening trend. Conversely, a sudden spike in both dominance and volume suggests a robust move worth considering. Comparing sectors on these charts also helps you spot rotation phases, where money flows out of one area and into another. This understanding enables you to anticipate potential opportunities and risks before they fully materialize in the broader market. Recognizing that market cycles often influence sector performance can further enhance your interpretation of these patterns. Additionally, being aware of market sentiment can help you better interpret the signals provided by dominance and volume data, as investor psychology often drives these shifts.
Furthermore, integrating volume analysis with sector comparison enhances your ability to interpret market signals. Volume confirms whether a dominance shift is backed by real buying or selling interest, preventing you from acting on superficial or misleading data. As you become more adept at reading these charts, you’ll notice that market rotation isn’t random but often follows identifiable patterns driven by economic cycles, news events, or investor sentiment. Recognizing that high refresh rates and low input lag are crucial for gaming experiences, you can similarly look for consistent and reliable signals in market data to improve your trading decisions. By paying close attention to how dominance levels evolve and validating those movements with volume analysis, you gain a clearer picture of the market’s direction, helping you make more confident, timely investment decisions.
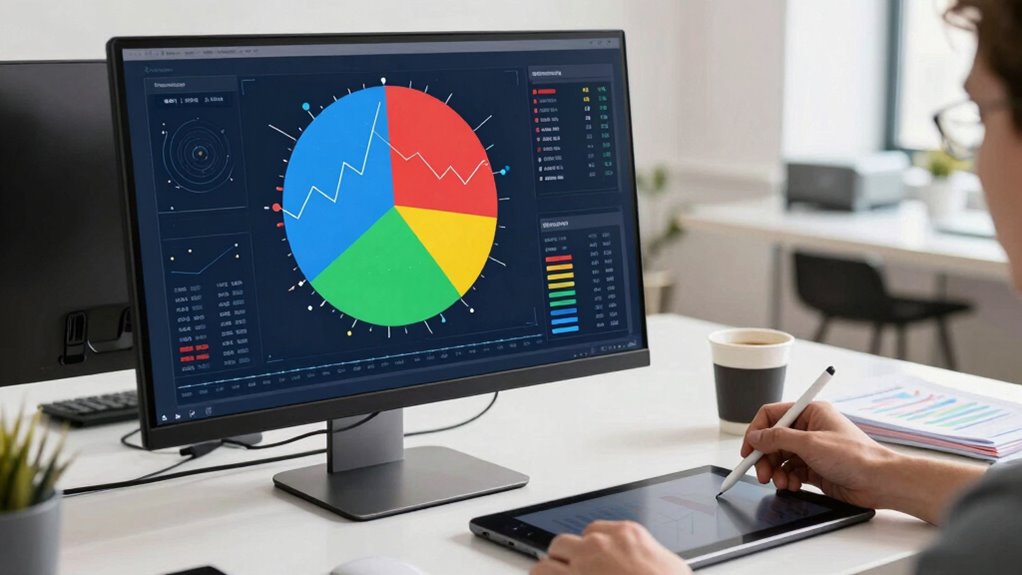
sector dominance analysis tools
As an affiliate, we earn on qualifying purchases.
As an affiliate, we earn on qualifying purchases.
Frequently Asked Questions
Can Dominance Charts Predict Future Market Movements Accurately?
Dominance charts can’t predict future market movements with complete accuracy, especially during periods of high market volatility. They help you identify trends and shifts in market leadership, but it is crucial to supplement them with technical indicators for better insight. By combining dominance charts with tools like moving averages or RSI, you can improve your chances of anticipating market turns, though no method guarantees precise predictions. Always remain cautious and adaptable.
What Are the Common Pitfalls When Interpreting Dominance Charts?
When interpreting dominance charts, you should watch out for misinterpretation risks and data accuracy issues. You might draw incorrect conclusions if you ignore chart limitations or rely on outdated data. Always verify data sources and consider market context to avoid misjudging trends. Rushing to conclusions can lead you astray, so take your time to analyze the charts thoroughly, ensuring your insights are based on accurate and current information.
How Frequently Should I Update My Dominance Charts?
You should update your dominance charts regularly, ideally weekly or bi-weekly, to keep your market rotation analysis accurate. Frequent updates help you spot shifts in dominance early, allowing you to adapt your strategies accordingly. If the market is volatile, consider more frequent updates. Consistent chart updates guarantee your market rotation analysis remains relevant, giving you a clearer picture of evolving trends and helping you make informed trading decisions.
Are Dominance Charts Applicable to All Asset Classes?
Yes, dominance charts are applicable to all asset classes, including stocks, commodities, and currencies. You should customize the chart design to suit each asset class comparison, highlighting key metrics relevant to that market. This flexibility helps you analyze rotation trends effectively across different markets. By adjusting your chart design, you can better identify shifts in dominance, making your market rotation analysis more extensive and insightful.
What Tools or Software Are Best for Creating Dominance Charts?
You should consider software like TradingView, MetaStock, or ThinkorSwim for creating dominance charts. These tools offer extensive chart customization options, allowing you to tailor the visuals to your needs. Plus, they integrate well with various data feeds, making it easier to analyze market rotation across asset classes. By choosing user-friendly platforms with robust customization and strong software integration, you can effectively develop dominance charts for your analysis.

Red Line 3 Performance Measurement Suggestions with Teacher Software
As an affiliate, we earn on qualifying purchases.
As an affiliate, we earn on qualifying purchases.
Conclusion
By mastering dominance charts, you gain a clearer view of market rotation, helping you anticipate shifts before they happen. For instance, if tech stocks show waning dominance while healthcare gains strength, you might consider reallocating your portfolio accordingly. This proactive approach allows you to stay ahead of trends, reducing risk and capturing opportunities early. Ultimately, using dominance charts empowers you to navigate the market’s ever-changing landscape with confidence and precision.

Maximum Trading Gains With Anchored VWAP – The Perfect Combination of Price, Time & Volume
Detailed explanations of AVWAP techniques for day traders, swing traders and investors. Plus, strategies to identify trade ideas,…
As an affiliate, we earn on qualifying purchases.
As an affiliate, we earn on qualifying purchases.
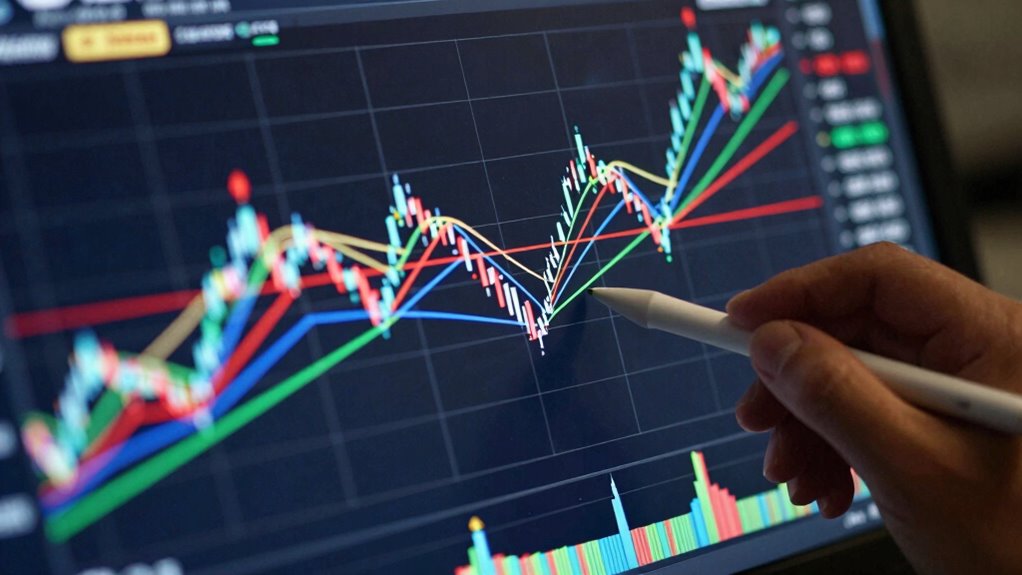
sector comparison tools for investing
As an affiliate, we earn on qualifying purchases.
As an affiliate, we earn on qualifying purchases.