To understand relative strength in crypto charts, focus on comparing how different cryptocurrencies perform over time. Look for assets showing consistent upward momentum and outperforming others, especially during market shifts. Use technical tools like RSI or comparative charts to spot early signs of strength or weakness. Pay attention to market sentiment and external factors that influence asset performance. Keep practicing, and you’ll uncover more ways to interpret these signals effectively.
Key Takeaways
- Compare the price performance of different cryptocurrencies over specific timeframes to identify outperformers and underperformers.
- Use technical indicators like RSI and relative strength charts to visualize momentum and strength differences.
- Analyze price trends against Bitcoin or market benchmarks to gauge a coin’s relative performance.
- Observe market momentum shifts and volume changes to assess the likelihood of trend reversals or breakouts.
- Consider external factors and market sentiment to contextualize relative strength signals and confirm technical insights.
Understanding relative strength in crypto charts is essential for making informed trading decisions. When you grasp how certain cryptocurrencies outperform others, you gain a clearer picture of market momentum and the underlying dynamics driving price movements. Relative strength isn’t just about looking at one coin’s price; it’s about comparing it to others to see which assets are gaining or losing ground. This comparison helps you identify potential breakouts, trend reversals, or signals that a coin is gaining strength before others do. By analyzing these aspects, you can position yourself better in the market and avoid falling into the trap of chasing after coins that are already losing momentum.
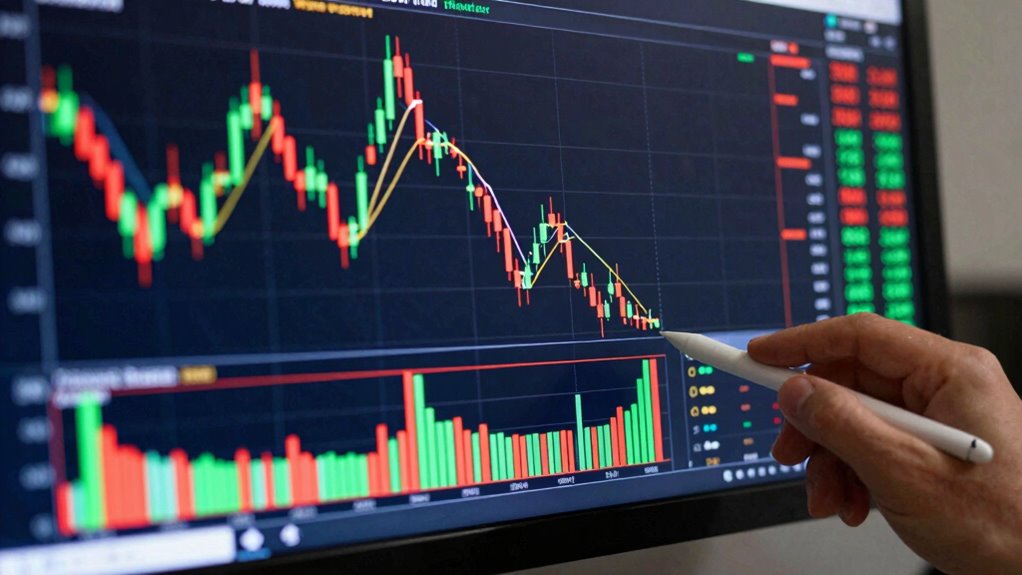
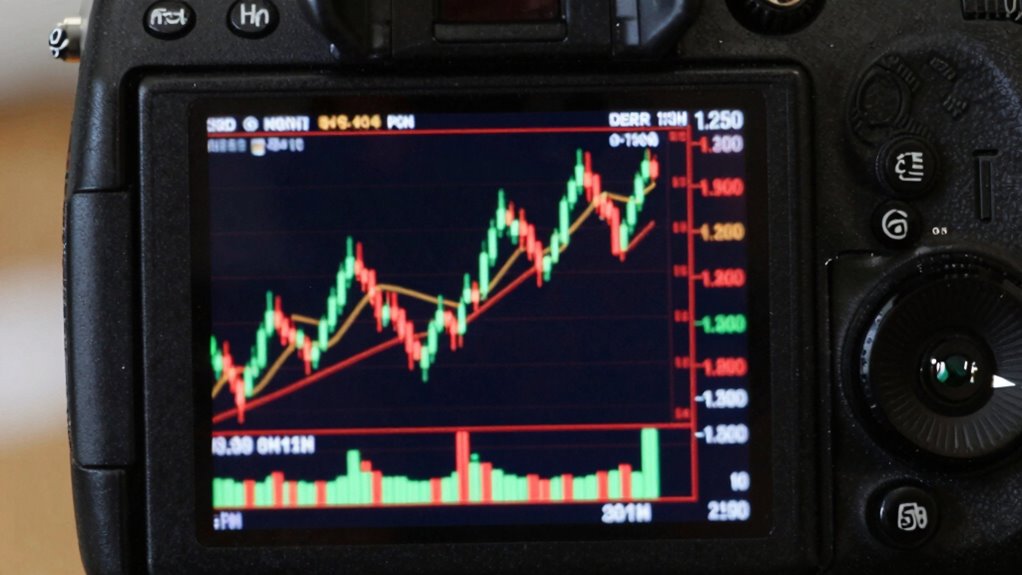
Market momentum plays a crucial role when you evaluate relative strength. When a cryptocurrency shows consistent upward movement, it indicates strong momentum, suggesting that traders are confident and buying in. Conversely, a coin with declining prices might be losing momentum, signaling that it’s time to reconsider holding or buying. You should pay attention to how quickly the price is rising or falling relative to its past performance and other coins. This kind of market momentum analysis helps you determine whether a coin is worth investing in now or if it’s better to wait for a more favorable entry point. The key is to look for signs of building strength or weakening, which can be spotted through visual cues on charts and through technical indicators. Recognizing market trends can further enhance your understanding of relative strength and improve your trading strategies. Additionally, understanding market sentiment can provide valuable context for relative strength analysis, helping you gauge whether the overall market mood supports a particular asset’s performance. Price comparison is a fundamental part of understanding relative strength. Instead of evaluating a coin in isolation, you compare its price movements against other cryptocurrencies or benchmarks. For example, if Bitcoin’s price is climbing steadily while altcoins lag behind or decline, Bitcoin’s relative strength is high, and it might continue to lead the market. On the other hand, if an altcoin starts outperforming Bitcoin, it’s a sign that the altcoin is gaining strength, and the market’s focus could shift. These comparisons help you recognize trends early, giving you an advantage in timing your trades. You can use tools like relative strength index (RSI) or comparative charts that visualize these relationships, making it easier to spot emerging opportunities or warning signs. Understanding market dynamics can also help you grasp how external factors influence relative strength and market movement.
In essence, understanding relative strength in crypto charts empowers you to read the market’s pulse more accurately. By observing market momentum and conducting clear price comparisons, you gain insight into which assets are likely to outperform others. This knowledge allows you to make strategic decisions rather than reacting impulsively to short-term price swings. Recognizing market volatility is also crucial, as it often signals potential shifts in relative strength and market sentiment. When you master these concepts, you become more attuned to the subtle shifts in market sentiment, helping you navigate volatile markets with confidence and precision.
RSI Trading Strategies: Relative Strength Index Based Trading Strategies
As an affiliate, we earn on qualifying purchases.
As an affiliate, we earn on qualifying purchases.
Frequently Asked Questions
Can Relative Strength Indicators Predict Future Price Movements Accurately?
Relative strength indicators can hint at future price movements, but they don’t predict with certainty. You need to contemplate market sentiment, which influences price trends, and watch for technical divergence, where the indicator and price move differently. These signals can help you identify potential reversals or continuations, but always combine them with other analyses to improve your accuracy. Relying solely on relative strength indicators isn’t enough for precise predictions.
How Often Should I Update Relative Strength Measurements?
You should update your relative strength measurements regularly, ideally daily or weekly, depending on your trading strategy. Using historical data within your technical analysis, frequent updates help you spot trends and shifts in momentum early. By consistently revising these measurements, you stay informed about the crypto’s performance relative to others, enabling more accurate decisions. Keep in mind, the more often you update, the better you can react to market changes.
Are There Specific Cryptocurrencies Better Suited for Relative Strength Analysis?
Imagine a lighthouse guiding ships through fog—certain cryptocurrencies shine brighter for analysis. You’ll find that well-established coins like Bitcoin and Ethereum, backed by strong fundamentals and high trading volume, are ideal for relative strength analysis. These assets offer clearer signals, making it easier to gauge momentum. By focusing on cryptocurrencies with solid fundamentals and active trading volume, you get more reliable insights, helping you make smarter trading decisions.
What Are Common Mistakes When Interpreting Relative Strength in Crypto?
A common mistake is relying solely on moving averages without considering volume analysis, which can mislead your interpretation of relative strength. You might assume a coin is strong just because its price is rising, but ignoring declining volume can hide a lack of genuine momentum. Always cross-check moving averages with volume trends to confirm strength signals, and avoid making decisions based on short-term fluctuations alone.
How Does Market Volatility Affect Relative Strength Analysis?
Market volatility can make relative strength analysis tricky because sudden price swings distort market sentiment and trading volume. When volatility spikes, a crypto’s apparent strength might seem stronger or weaker than it truly is, leading you to misjudge its momentum. To counter this, you should focus on longer-term trends, monitor trading volume for confirmation, and avoid making decisions based solely on short-term volatility, which can be misleading.

Crypto Trading Mat for Desk – Crypto Mouse Pad with Candlestick Chart Patterns – Excel & Word Shortcuts – Anti-Slip Durable & Smooth Surface – Gifts for Crypto Lovers and Traders
✔【COMPLETE CRYPTO TRADING GUIDE】- Features 31 candlestick patterns, 22 chart formations, blockchain technology explanations, and cryptocurrency fundamentals. Essential…
As an affiliate, we earn on qualifying purchases.
As an affiliate, we earn on qualifying purchases.
Conclusion
By mastering the art of reading relative strength, you’re like a seasoned navigator steering through a stormy sea of crypto charts. It’s your compass, guiding you past the treacherous waves of volatility toward the calm waters of profitable trades. Keep your eyes sharp and your instincts sharper, and you’ll turn complex data into a trusted map. With this skill, you’re not just observing the market—you’re commanding your destiny in the vast crypto ocean.
Crypto market momentum analysis software
As an affiliate, we earn on qualifying purchases.
As an affiliate, we earn on qualifying purchases.

Blockchain Bitcoin Cryptocurrency Wallet Mining Altcoin Digital Currency Ledger Token Satoshi Smart Contract Throw Pillow, 16×16, Multicolor
100% spun-polyester fabric
As an affiliate, we earn on qualifying purchases.
As an affiliate, we earn on qualifying purchases.