

A descending triangle signals a potential bearish move in crypto trading, showing lower highs while support stays steady. You watch for the resistance trendline to decline and volume to decrease during formation, indicating consolidation. When the price breaks below support with high volume, it often confirms a downtrend. To avoid false signals, wait for strong volume for confirmation and consider other indicators. If you want to understand how to spot and use this pattern effectively, keep exploring the details.

Get hardware and tech essentials delivered free with Prime
- Fast, free delivery on millions of items
- Prime Video, Amazon Music and more included
- Member-only deals all year
Key Takeaways
- A descending triangle signals potential bearish continuation as lower highs form while support remains stable.
- Volume typically decreases during the pattern’s formation, with a surge during a confirmed breakout.
- A breakout below support on high volume suggests strong selling pressure and a likely downward trend.
- Traders often wait for a retest of broken support (now resistance) before entering short positions.
- Proper risk management includes using stop-loss orders and confirming breakouts with volume analysis.
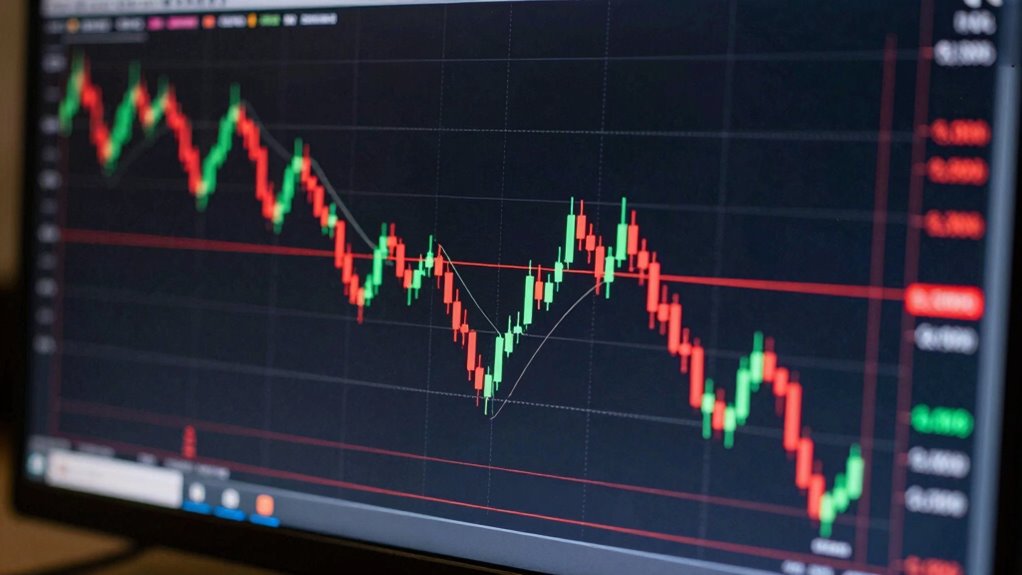
A descending triangle is a common chart pattern in crypto trading that signals potential bearish momentum. When you see this pattern forming, it usually indicates that sellers are gradually gaining strength, pushing the price to lower lows while buyers try to hold the support line. The pattern is characterized by a flat or slightly rising support level and a declining resistance trendline. As the pattern develops, it’s essential to pay attention to volume analysis. Typically, volume decreases during the formation of the triangle, reflecting a period of consolidation. However, a significant increase in volume often accompanies a breakout, confirming the direction of the move. This is where breakout strategies come into play. When the price breaks below the support line with high volume, it suggests strong selling pressure, and you can consider entering a short position or selling your holdings.
Understanding the role of volume analysis helps you gauge the strength of a breakout. A breakout on low volume might be a false signal, leading to a quick reversal or a retest of the support level. Conversely, a breakout backed by high volume indicates conviction among traders and increases the likelihood of a sustained move downward. This makes volume analysis an indispensable tool for confirming breakouts and avoiding traps. Additionally, knowing how to verify lubricant specs can help you ensure the quality and authenticity of your trading instruments or tools, reducing the risk of counterfeit products. Incorporating technical indicators can further refine your entry and exit points, making your trading strategy more robust. Recognizing how market psychology influences price movements can also help you better interpret the pattern’s implications and potential outcomes. Moreover, understanding common chart patterns like the descending triangle can improve your overall ability to anticipate market moves. Including risk management techniques, such as setting stop-loss orders, is crucial to protect yourself from unpredictable market swings.
Your goal with breakout strategies is to identify these key moments early enough to maximize profit while minimizing risk. When the price approaches the triangle’s apex, watch for an increase in trading activity. A decisive move below the support line on high volume is your cue to act. Some traders also wait for a retest of the broken support level—once it turns into resistance—before entering a short position. This strategy helps guarantee that the breakout is genuine rather than a false signal.
In crypto markets, quick reactions are imperative. The pattern’s formation gives you clues about potential price directions, but volume analysis and breakout confirmation are what give you confidence. Remember, not every break below support leads to a long-term decline, so managing your risk with stop-loss orders is wise. By combining these insights—monitoring the pattern, analyzing volume, and applying breakout strategies—you can better navigate the risks and opportunities that descending triangles present in crypto trading.
cryptocurrency trading chart patterns
As an affiliate, we earn on qualifying purchases.
As an affiliate, we earn on qualifying purchases.
Frequently Asked Questions
Can a Descending Triangle Appear in Both Bullish and Bearish Markets?
Yes, a descending triangle can appear in both bullish and bearish markets. When analyzing volume, you’ll notice decreasing volume during the pattern’s formation, signaling potential breakout points. Pattern recognition helps you identify these triangles early, giving you an edge in decision-making. In bullish markets, it might signal a reversal, while in bearish markets, it indicates continuation. Stay alert to volume shifts and price action for effective trading strategies.
How Reliable Is the Descending Triangle Pattern Across Different Cryptocurrencies?
Like a lighthouse in a storm, the descending triangle pattern offers guidance, but its reliability varies across cryptocurrencies. You should rely on volume analysis to gauge pattern strength—rising volume confirms potential breakouts. While it’s generally a trustworthy indicator, its accuracy isn’t absolute; market volatility can distort signals. Always combine pattern recognition with other tools to make well-informed trades, because no pattern guarantees success in the unpredictable crypto seas.
Are There Specific Indicators That Confirm a Descending Triangle Breakout?
Yes, certain indicators can confirm a descending triangle breakout. You should watch volume analysis closely; a significant increase in volume often signals a strong breakout. Also, keep an eye on support levels—if the price breaks below the support line with high volume, it confirms the pattern. These indicators help you verify whether the descending triangle is likely to lead to a sustained move, reducing false signals.
What Is the Typical Time Frame for Descending Triangles to Form?
A descending triangle typically forms over a few weeks to a couple of months, depending on the asset and market conditions. You should analyze volume patterns—look for decreasing volume during the pattern’s formation, which signals weakening buying pressure. The pattern duration varies, but consistent volume analysis helps confirm its development. Keep an eye on the convergence of the horizontal support and descending trendline to identify when the breakout may occur.
How Should Traders Manage Risk During a Descending Triangle Pattern?
You should manage risk during a descending triangle by placing your stop loss just above the resistance line to limit potential losses. Use volume confirmation to validate the pattern; decreasing volume suggests a potential breakout, while a spike confirms it. Stay disciplined by adjusting your stop loss as the pattern develops, and consider taking profits if the price moves favorably, ensuring you protect gains and minimize downside risk.
descending triangle crypto indicator
As an affiliate, we earn on qualifying purchases.
As an affiliate, we earn on qualifying purchases.
Conclusion
Understanding a descending triangle in crypto trading equips you with a powerful tool to anticipate market moves, potentially saving you from catastrophic losses or revealing massive gains. When you recognize this pattern early, you’re fundamentally wielding a crystal ball, foreseeing price drops with uncanny accuracy. Mastering its nuances can make you feel like a trading wizard, turning complex charts into your personal treasure map. So stay sharp, keep studying, and let this pattern be your secret weapon in the volatile crypto world.
As an affiliate, we earn on qualifying purchases.
crypto trading risk management tools
As an affiliate, we earn on qualifying purchases.
As an affiliate, we earn on qualifying purchases.
Halloween Picks
halloween
As an affiliate, we earn on qualifying purchases.