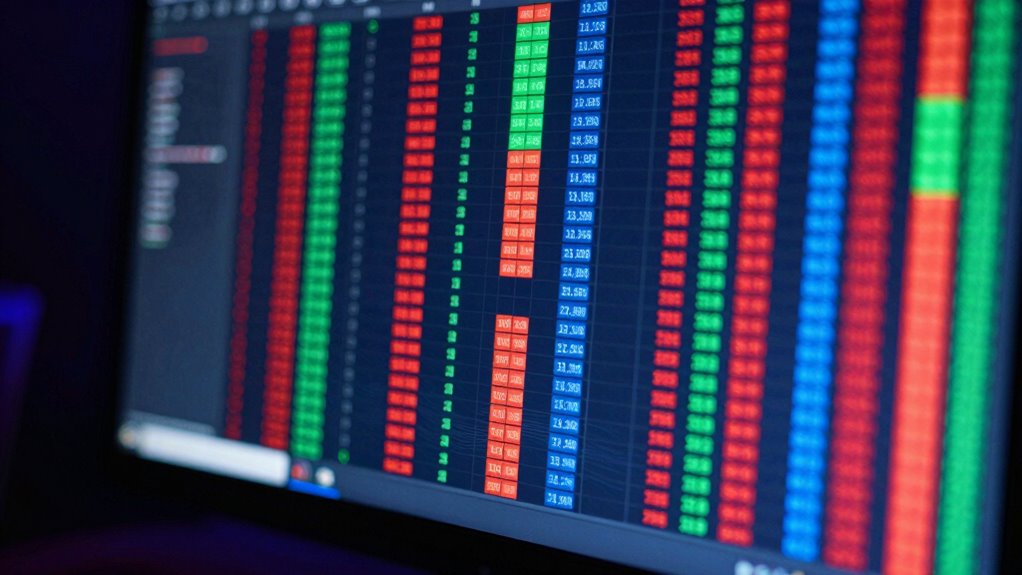

To identify sector rotation on a crypto heatmap, focus on how colors and block sizes change over time. Bright green or red signals strong momentum or weakness, while fading shades suggest slowing activity. Larger tiles show high trading volume, indicating key sectors, while smaller ones may signal emerging trends. Watch for shifts from green to red or vice versa to spot potential trend reversals. Keep analyzing these visual cues, and you’ll gain a sharper edge in steering market shifts.

Get hardware and tech essentials delivered free with Prime
- Fast, free delivery on millions of items
- Prime Video, Amazon Music and more included
- Member-only deals all year
Key Takeaways
- Observe color changes and intensity to identify shifts from green (buying) to red (selling) indicating sector rotation.
- Analyze block sizes to assess the significance of movement based on trading volume or market cap.
- Cross-reference visual cues with recent news to validate justified sector movements or anticipate reversals.
- Monitor time-based changes to spot emerging trends or reversals, focusing on shifts over minutes, hours, or days.
- Combine heatmap signals with overall market sentiment for informed decisions on sector rotation and timing.
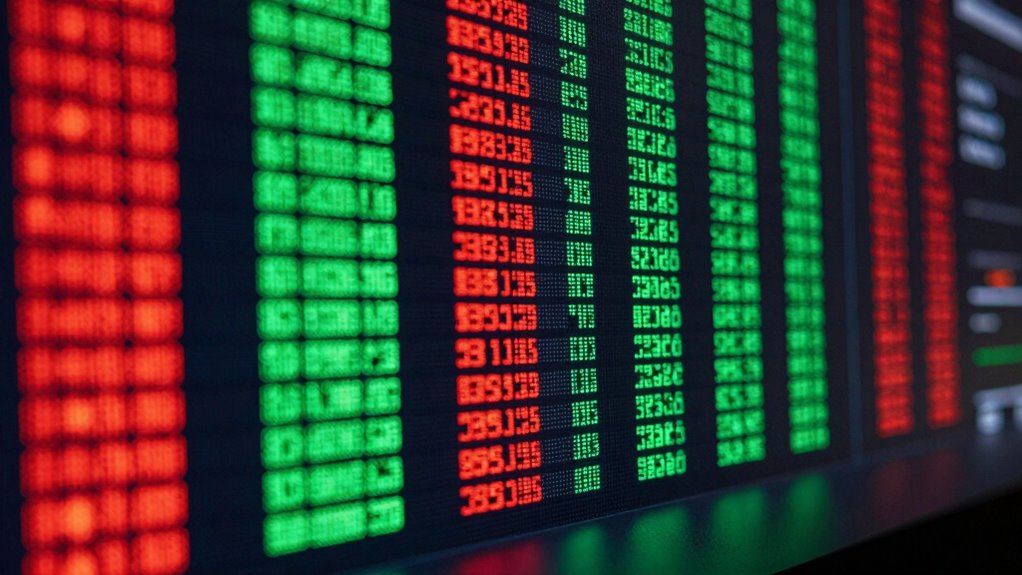
Ever wondered how to quickly gauge the overall strength or weakness of different crypto sectors? That’s where a crypto heatmap becomes your best friend. It visually presents the current state of various cryptocurrencies and sectors, making it easier to spot opportunities and risks in real time. When you look at a heatmap, you’re fundamentally seeing the latest cryptocurrency trends laid out in a color-coded grid. Green usually indicates strong performance, while red signals weakness. This immediate visual cue helps you understand the market sentiment—whether investors are bullish or bearish across different sectors. By analyzing these patterns, you can better decide where to allocate your resources or when to wait on the sidelines.
To interpret a crypto heatmap effectively, start by noting the color intensity. Bright green or red suggests significant movement, indicating a sector that’s either rapidly gaining momentum or experiencing a sharp decline. Less intense shades point to more moderate activity, giving you a sense of where the momentum is building or fading. Keep in mind that market sentiment often drives these movements. If most sectors are green, it signals widespread optimism, possibly driven by positive news or favorable cryptocurrency trends. Conversely, a sea of red hints at fear or uncertainty prevailing among investors, perhaps due to regulatory concerns or macroeconomic shifts. Recognizing the role of market sentiment is crucial in understanding these visual cues and their implications.
Next, pay attention to the size of the blocks or tiles representing each sector. Larger blocks typically mean higher trading volume or market cap within that sector, making their movements more impactful. Smaller tiles might indicate less liquidity or interest but can still serve as early indicators of emerging trends. Cross-reference these visual cues with recent news or macroeconomic developments to confirm whether the sector’s movement is justified or if it’s likely to reverse. Additionally, understanding sector rotation can help you anticipate where capital might flow next, providing an edge in timing your trades.
Another vital aspect is observing the heatmap over time. Many platforms allow you to see changes in the heatmap across different timeframes—minutes, hours, or days. Watching how sectors evolve from green to red or vice versa gives you insight into sector rotation, the process where investors shift their capital from one part of the market to another. Sudden shifts can signal a trend reversal or the start of a new cycle, helping you position yourself ahead of the market. Moreover, observing these shifts over multiple periods can help you distinguish between short-term volatility and sustained trends.
Ultimately, reading a crypto heatmap is about integrating visual cues with your understanding of cryptocurrency trends and market sentiment. By doing so, you gain a clearer picture of the market’s current landscape and can make more informed decisions in your crypto investments. Developing a keen eye for these signals, combined with market analysis skills, can greatly enhance your ability to navigate the dynamic crypto environment.
As an affiliate, we earn on qualifying purchases.
Frequently Asked Questions
What Are the Best Tools to Create a Crypto Heatmap?
You can use tools like CoinMarketCap, CryptoCompare, and TradingView to create a crypto heatmap. These platforms offer robust cryptocurrency analytics and excel in visual data representation, helping you identify sector rotations easily. They allow customization, real-time updates, and detailed visualizations, making it simple to spot trending sectors. By leveraging these tools, you get a clear overview of market movements, enhancing your investment decisions through effective heatmaps.
How Often Should I Update My Crypto Heatmap?
You should update your crypto heatmap regularly, ideally daily or even multiple times a day, especially during periods of high market volatility. This guarantees you’re working with the most current data, which is vital for accurate sector rotation decisions. Frequent updates help you respond swiftly to sudden market shifts, maintaining data accuracy and giving you a strategic edge in steering through volatile crypto markets.
Can Heatmaps Predict Future Sector Performance?
Yes, heatmaps can hint at future sector performance by highlighting shifting market sentiment and emerging investment trends. You see, by observing patterns of color changes and intensities, you can predict potential pivots in sectors. While heatmaps don’t guarantee gains, they serve as strategic snapshots, signaling when to seize opportunities or stay cautious. Stay sharp, scan swiftly, and synthesize signals to stay ahead in the ever-evolving crypto landscape.
Are Heatmaps Reliable for Short-Term Trading Decisions?
Heatmaps can be helpful for short-term trading decisions, but you should be cautious because market volatility can cause false signals. They provide a visual snapshot of sector activity, but they don’t guarantee future movement. Use heatmaps alongside other tools and analysis methods to confirm trends, especially during volatile times. Relying solely on heatmaps might lead you to make impulsive decisions based on misleading signals.
How Do Heatmaps Differ Between Crypto and Traditional Markets?
Like a knight from a bygone era, crypto heatmaps differ from traditional market heatmaps mainly in how they reflect market volatility and sector correlation. Crypto heatmaps often display rapid, intense shifts, highlighting the high volatility of digital assets. In contrast, traditional markets tend to show more stable, sector-based movements. Understanding these differences helps you interpret the heatmaps better, enabling smarter decisions amid the dynamic landscape of both markets.
cryptocurrency sector rotation indicator
As an affiliate, we earn on qualifying purchases.
As an affiliate, we earn on qualifying purchases.
Conclusion
By mastering how to read a crypto heatmap, you’re fundamentally holding a compass that guides your sector rotation strategy. Think of it as your personal weather forecast—spotting storms (declines) and sunny spells (gains) before they hit. With practice, you’ll navigate the crypto seas confidently, steering clear of storms and riding the waves of opportunity. Keep your eyes on the heatmap, and let it be your lighthouse in the often turbulent crypto waters.
trading volume heatmap for crypto
As an affiliate, we earn on qualifying purchases.
As an affiliate, we earn on qualifying purchases.
market sentiment analysis software
As an affiliate, we earn on qualifying purchases.
As an affiliate, we earn on qualifying purchases.
Fall Picks
fall essentials
As an affiliate, we earn on qualifying purchases.